Hi everyone!
Welcome to the September Monthly Challenge: Data in Disguise! This month is all about showcasing how you use markups as more than just visuals.
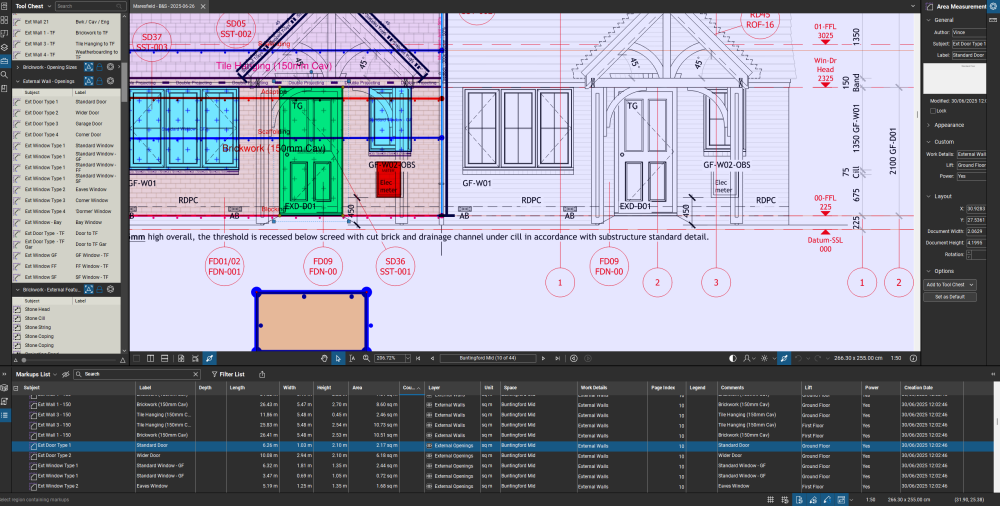
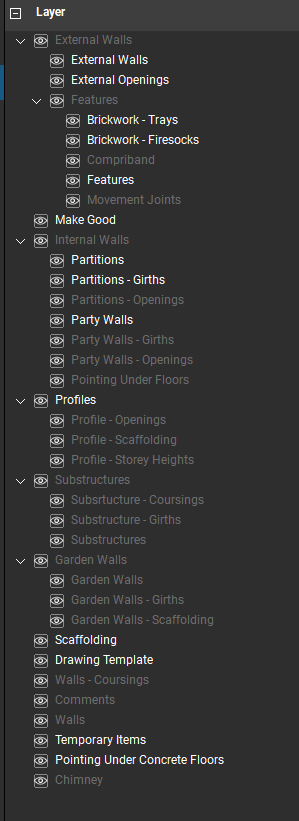
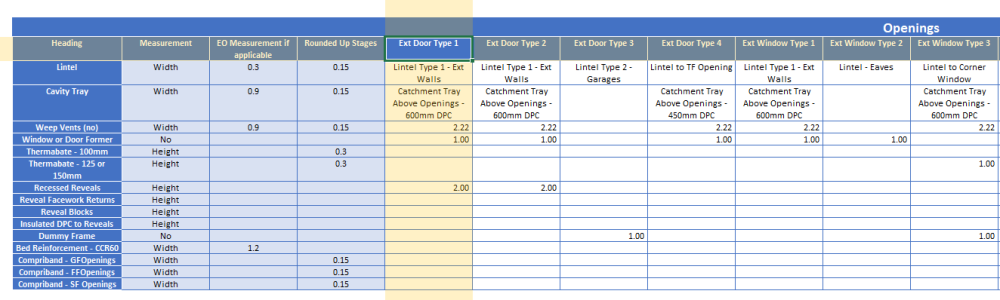
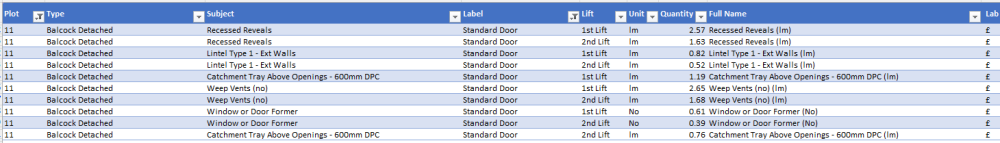
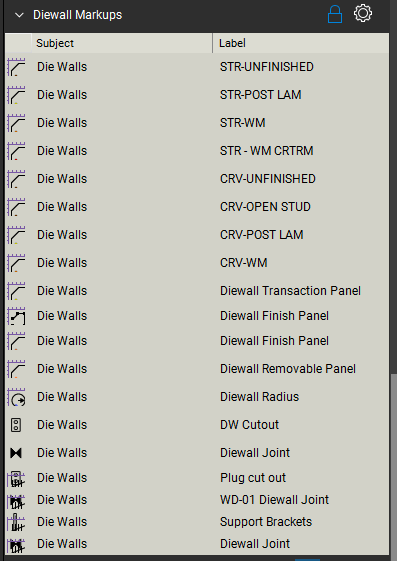
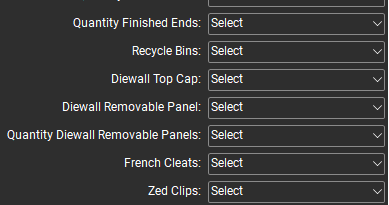
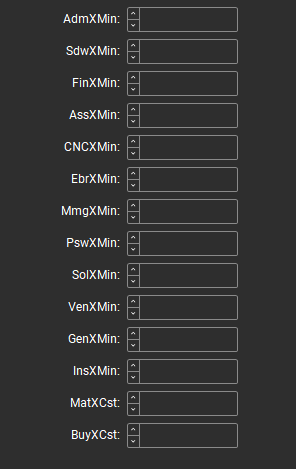
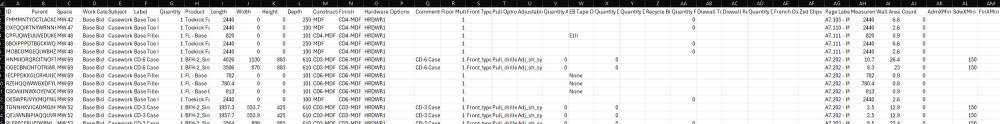
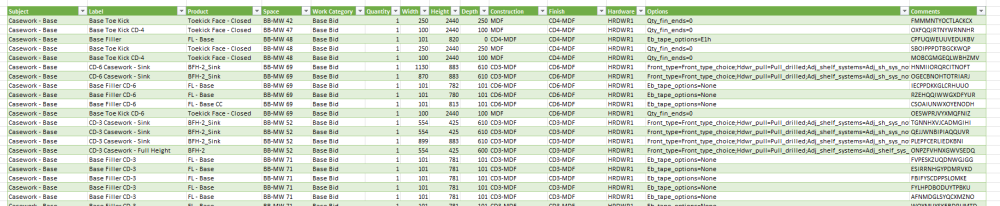
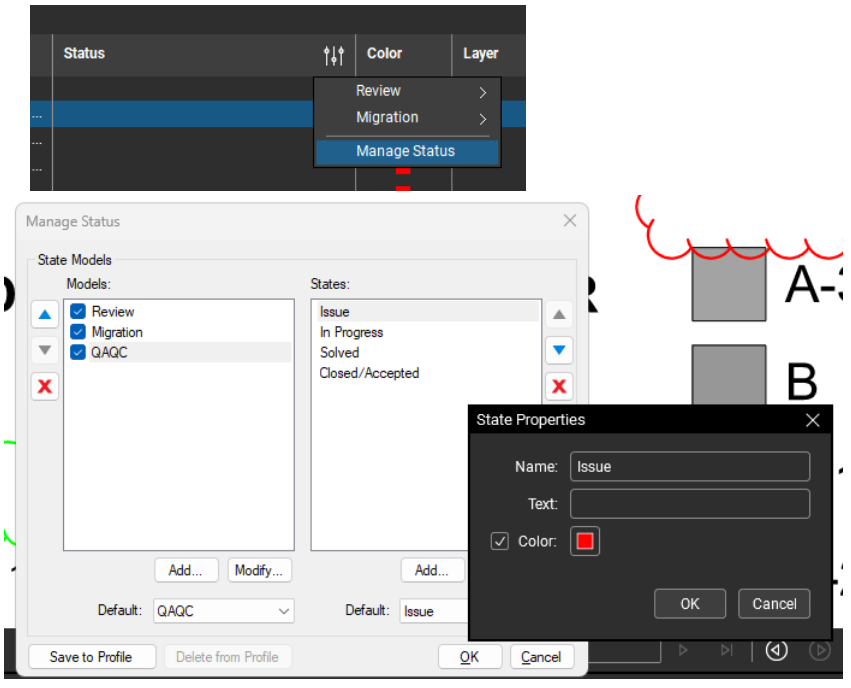
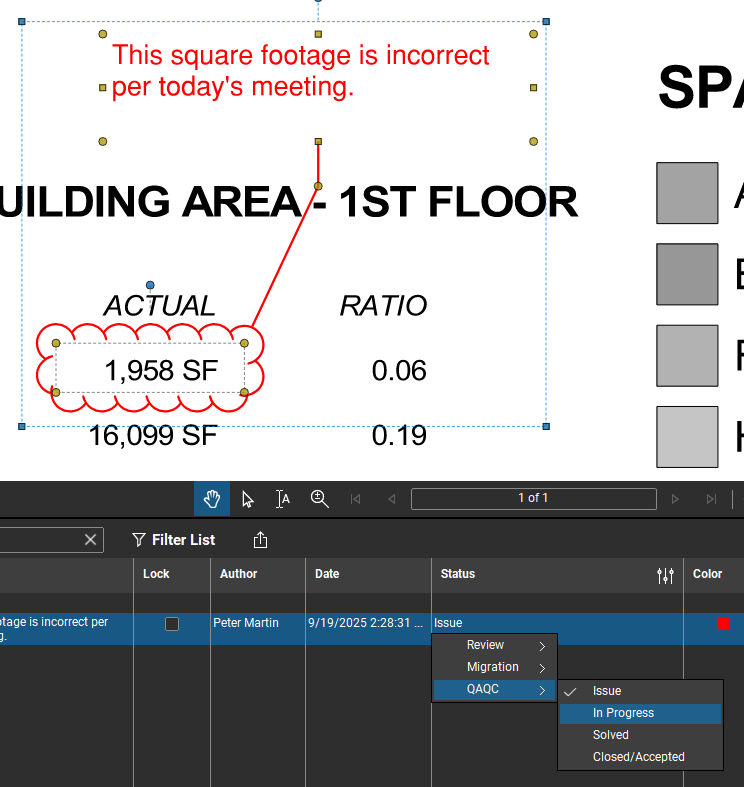
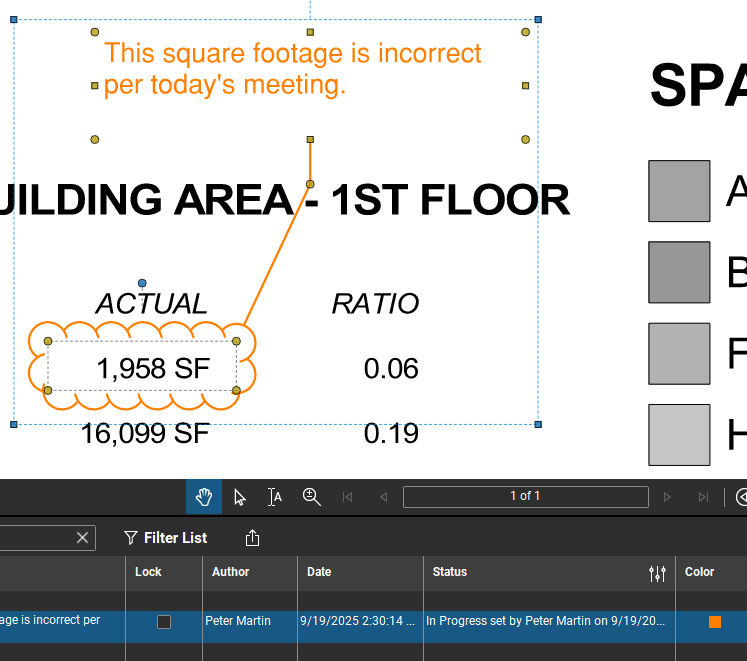
Markups may look simple at first glance, but often they carry a lot more information. From measurements and quantities to statuses, costs, and notes. Markups can be packed with valuable data that drives your projects forward.
Do your markups track more than just visuals like quantities, costs, or statuses? Share how you make them smarter, more informative, and more powerful!

📝 How to Participate
🤝 Share an example of a markup that does more than meets the eye. Post a screenshot or description of your markup and explain how it supports your workflow.
💬 Discuss how others are using markups. You might uncover a new trick to put to work in your own projects.
🏅 Rewards
All participants will earn a unique challenge badge and points to level up in the community!
📚 Resources
https://www.youtube.com/%40BluebeamInc/videos
How to Use Markups in Bluebeam Revu
Working with Markup Tools
The Markups List and Markup Data